|
we could STILL kill just as many. |
 |
|
|
we could STILL kill just as many. |
 |
|
| Introduction
We use figures from official sources and well respected research to show that we could reduce all UK speed limits to just 12 mph and still have the same numbers killed on the road. |
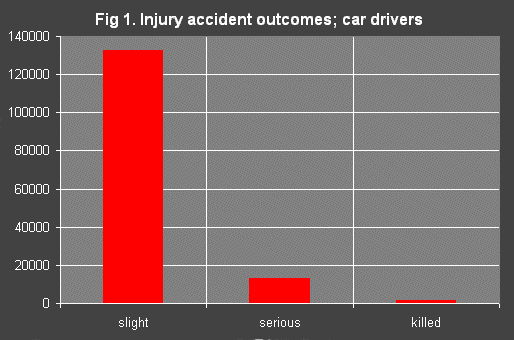
 Working entirely from official figures this chart (Fig 1) shows the proportion of UK car drivers, injured, seriously injured, and killed on UK roads in 2001 (the last year on record). See the source figures here (table 5c). We chose car drivers because they are typical of all trends, they are affected by legislation, and also because they fit the categories below. There's nothing special or clever about choosing car drivers. In 2001 in GB, 132,318 were slightly injured, 12,555 were seriously injured and 1,164 were killed. Notice how we can use these figures to deduce the probability of death in a collision. If you add up all the figures and compare the total to the number killed you can deduce that drivers in injury accidents have a 1 in 125 chance of being killed. |
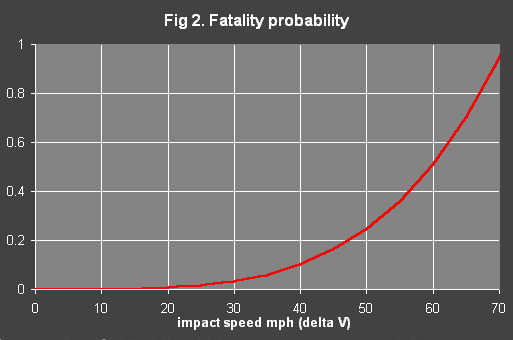
 Highly respected research in 1993 (Joksch) determined the probability curve in this graph (Fig 2). It shows for example that in a 60 mph crash a car driver is 50% likely to die. The equation is properly applied to "change in speed", sometimes known as "delta V". If there was a crash at 90 mph and after the crash due (perhaps) to "glancing off" the vehicle was travelling at 30 mph in the same direction then the crash had a change in speed of 60 mph. Similarly hitting a heavy fixed object at 40 mph and ending up at 0 mph would have a change in speed of 40 mph. We fully accept the findings of the research. They determined that risk of death varied with the fourth power of speed according approximately to the following equation:
Like the first chart above (fig 1) this graph and equation deals with the probability of dying in an accident. ref: Joksch, H.C. Velocity Change and Fatality Risk in a Crash -- A Rule of Thumb. (summary) |
| Putting the two together
We realised that these two pieces of information could be combined. We can calculate the average crash speed from the proportion of drivers killed. We know the proportion of drivers who are killed, and we can use the equation for fig 2 to calculate an average impact speed. From the first graph (Fig 1) we know the real probability of death to a car driver from an injury accident.
Perhaps you're worried that Joksch's equation is unreliable below about 30 mph? Let's see how many would have died at 30 mph:
This is about 4 times the number who do die, so we can see clearly that the average impact speed is significantly less than 30 mph. So we could reduce the speed limit to 30 mph over the entire country, enforce it rigidly and still kill 4 times more than we do at present. |
| Getting a little more realistic.
So far we've only looked at injury accidents. Perhaps we should make things a little more realistic by looking at all accidents? One problem is that damage only accident figures are not gathered nationally. There's some data from the insurance industry, but we'll need to do a little intelligent guesswork. There were about 4,000,000 motor insurance claims for the last year on record (2,000). We'll assume that 75% were vehicle accidents, and 50% of those applied to private motor cars. So we have 1.5 million accidents (give or take)
But there's more...
|
| Conclusion
We've shown without room for doubt that the average speed of a fatal accident on a UK road and affecting a car driver is less than 12 mph. Since 12 mph bears no relation to any free travelling speed used on UK roads "something" must intervene between free travelling and the actual crash. This "something" is of course driver response. No one wants to crash. Most drivers, most of the time have effective strategies for avoiding crashes. In practise the failures of these crash avoiding strategies are not normally massive blunders resulting in impacts at free travelling speeds. Instead they are subtle misjudgements followed avoiding actions leading to mostly minor crashes. The ratio of minor crashes to fatal accidents is probably greater than 1,500:1. Perhaps you might wonder if speeding is a separating factor between the 1,500 survivors and the 1 fatal? With 70% of drivers exceeding the speed limit at sample sites it would be an entirely unreasonable conclusion. It isn't speed that kills. We can reduce the speed limits endlessly or enforce them perfectly without ever hoping to get close to the thresholds where free travelling speed will play a larger part in the outcome than driver based factors like skill, attention, attitude and training level. In fact, small variations in these factors will have far more effect on accident rates and outcomes than big variations in limited or enforced speed. See elsewhere on this web site. |
| Comments
Comments on the above are welcome. If there is a demand we will create a comments page. We will be delighted to publish all suitable emails including those whose content we disagree with. Email comment. |
Promoting intelligent road safety