|
|
 |
|
|
|
 |
|
| Introduction
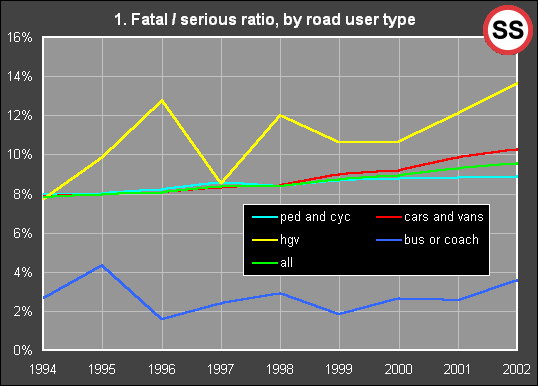
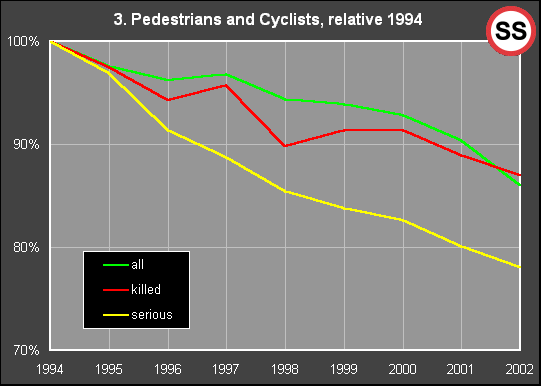
This page provides further information in support of our page "serious". The "serious" page points out that our national serious road injury figures are behaving strangely relative to killed and slight injury figures. It was suggested to us that the altered ratios might be due to vehicle air bags or some other localised effect. We investigated ratios across road user types and across road types. In all cases the serious injury figures exhibit the same strange behaviour. See the graphs below: |
 |
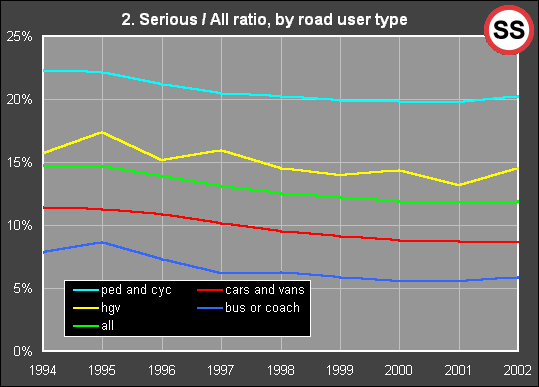
This graph shows falling trends in the serious injuries / all injuries ratio for all road user groups |
|
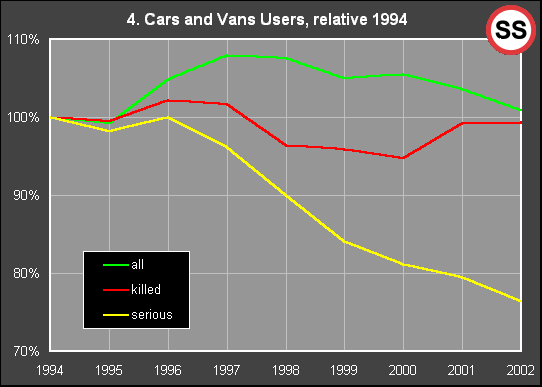
The strange behaviour of the serious injury figures is clear in this large road user group |

Since speed limiters were installed across the board in heavy vehicles fatalities have risen very markedly. |
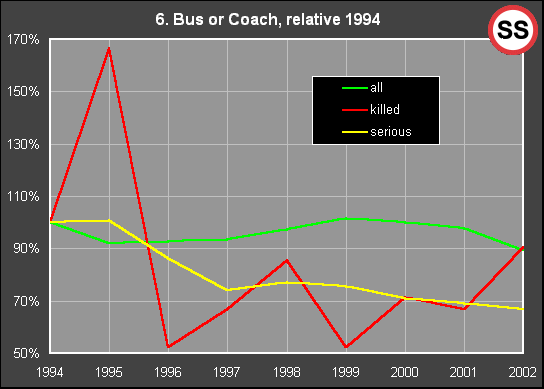
Small numbers of injuries (and especially fatalities) make it hard to be sure about the trends for bus and coach occupants. |
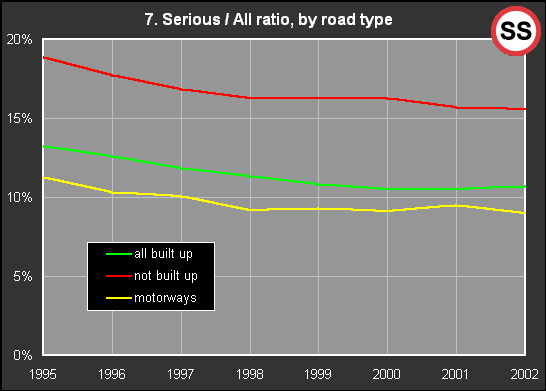
The serious injuries / all injuries ratio is falling for all road types |
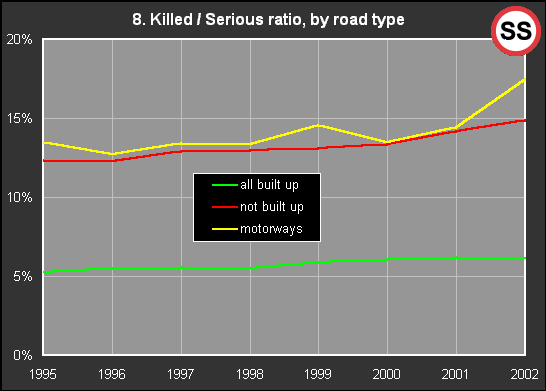
This graph shows rising trends in the killed / serious injury ratio for all road types |
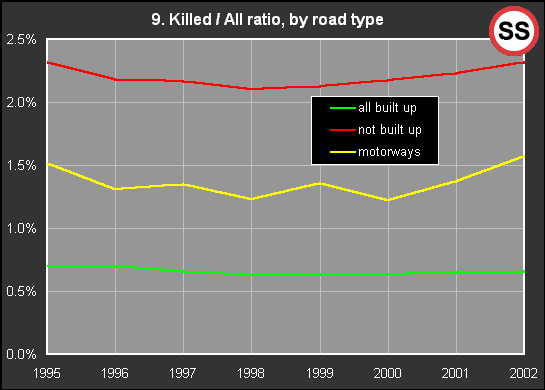
This graph shows no overall trend in the killed / all severities ratio |
| Comments
Safe Speed encourages comments, further information and participation from our visitors. See our (forums). Read about our comments policy (here). This page provides data to support the observations on the "serious" page. Consequently the comments topic includes both pages. You can (view) or (add comment) to the forum topic for these pages. Posting in the forum requires simple registration. |
Calling for real road safety, based on truth