|
|
 |
|
|
|
 |
|
| Introduction
Many thanks to Eamon Scott for obtaining and forwarding the data. You can download our spreadsheet (here). Official figures from "Road Accidents Scotland,
2000" show that the following road accidents were recorded:
|
||||||||||||

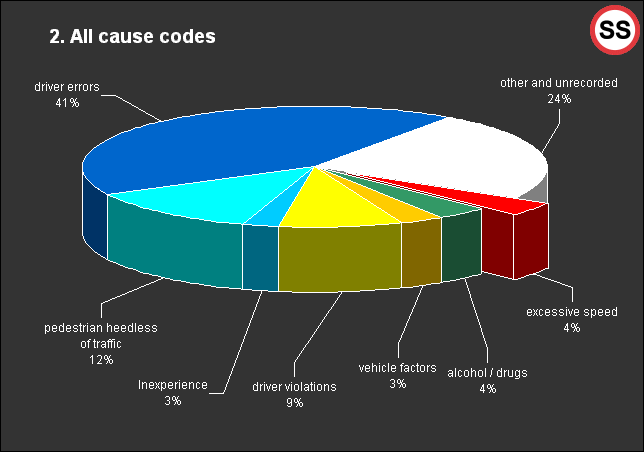
This chart analyses the number of first factors against the total number of accidents. |
||||||||||||

This chart analyses the number of times a factor was recorded (either as first, second or third factor) against the total number of factors recorded. |
||||||||||||
| Conclusions
The largest factor in all accidents is driver error, as usual. Excessive speed is a first factor in 3.32% of accidents. Adding together factors 1, 2 and 3, excessive speed was reported a total of 62 times against a total of 1,174 injury accidents. Therefore excessive speed was reported in just 5.28% of accidents. Since more than 1 factor was recorded for many accidents this percentage is not suitable for a pie chart - the slices would add up to more than 100%! "Fatigue" is listed just 6 times, (0.5%). The low figure is probably because Tayside lacks monotonous roads. |
You can't measure safe driving in miles per hour